RGUHS Nat. J. Pub. Heal. Sci Vol: 15 Issue: 2 eISSN: pISSN
Dear Authors,
We invite you to watch this comprehensive video guide on the process of submitting your article online. This video will provide you with step-by-step instructions to ensure a smooth and successful submission.
Thank you for your attention and cooperation.
1Department of Biochemistry, PDU Medical College, Rajkot, Gujarat, India
2Department of Biochemistry, GMERS Medical College, Morbi, Gujarat, India
3Department of Biochemistry, BANAS Medical College & Research Institute, Palanpur, Gujarat, India
4Narendra Modi Medical College & LG Hospital, Ahmedabad, Gujarat, India
5Dr. Mayurkumar Goradhanbhai Makadia, Department of Biochemistry, PDU Medical College, Rajkot, Gujarat, India.
6Department of Biochemistry, PDU Medical College, Rajkot, Gujarat, India
*Corresponding Author:
Dr. Mayurkumar Goradhanbhai Makadia, Department of Biochemistry, PDU Medical College, Rajkot, Gujarat, India., Email: mayurgmakadia@gmail.com
Abstract
Background and Objectives: Neonates admitted to the intensive care units are susceptible to developing electrolyte imbalances, which can result in an increased mortality rate. Measuring electrolyte levels, particularly sodium (Na+) and potassium (K+), is often necessary in seriously ill patients. The present study aimed to compare the concentration of sodium and potassium between the arterial blood sample and serum from the venous blood sample.
Methods: We retrospectively studied 100 hospitalized neonates in the Neonatal Intensive Care Unit (NICU) whose samples were taken for ABG and serum electrolytes simultaneously, and both samples were processed on GEM PREMIER 3000 and Roche AVL 9180 Electrolyte Analyzer, respectively. Statistical measures employed to compare the data included the Pearson correlation coefficient and Bland-Altman plots.
Results: The mean concentration of sodium Na+ was 135.05 mmol/L (SD) = 6.69 mmol/L) using the ABG and 135.36 mmol/L (SD = 6.54 mmol/L) using the serum sample. The mean level of the K+ was 3.91 mmol/L (SD = 0.86 mmol/L) using the ABG and 4.12 mmol/L (SD = 0.91 mmol/L) using the serum sample. The associated correlation coefficients were 0.89 and 0.88 respectively.
Conclusion: We conclude that the results for Na+ and K+ are like those of the ABG sample and serum from the venous blood sample. So, one can decrease the amount of blood sample volume and the number of needle punctures required for electrolytes assessment in neonates admitted to the NICU.
Keywords
Downloads
-
1FullTextPDF
Article
Introduction
Recent studies have shown that serum sodium (Na+) and potassium (K+) levels significantly predict mortality among ICU patients. Therefore, electrolyte imbalances in ICU patients must be addressed fully and quickly.1,2 Usually, two methods are employed each day. On one side, central laboratory auto analyzers (AAs) routinely evaluate electrolytes from serum. Nonetheless, the duration required to receive the results after blood collection relies on multiple factors, such as the time taken for transport post-collection, sample handling, and analysis by the laboratory.1 Such a delay might endanger the treatment of patients who are critically ill. Conversely, arterial blood gas analyzers (ABGA) are utilized in nearly all critical care units and ICUs since they provide rapid data collection and therapeutic feedback, as ICU patients can exhibit nonspecific indicators and symptoms of electrolyte imbalances.3-6 ABG analysis typically takes 10-15 minutes to complete.7 Serum electrolyte estimation takes up to 1.5 hours.8 Yilmaz et al., identified notable variations in Hb, potassium, and sodium levels between ABG and venous blood in the ICU.9
Jain et al., determined that ABG outcomes for potassium and sodium were not interchangeable for venous blood tests after comparing arterial and venous blood results in the urgent care facility.10 Nonetheless, Allardet Servent et al., and concluded that arterial blood analysis revealed no notable difference in potassium and sodium levels compared to venous blood tests. ABG could be examined instead of blood tests from veins.11,12 The United States Clinical Laboratory Improvement Amendment (US CLIA) 2006 allows a variation of 0.5 mmol/l in potassium measurements and 4 mmol/l in sodium measurements compared to the standard gold measure calibration liquids.13
Nevertheless, as far as we are aware, no research has compared the venous and arterial electrolyte levels in newborns in Gujarat.
To decrease the frequency of phlebotomies, this study aims to compare sodium and potassium concentrations between ABG and Serum electrolytes and establish a relationship between both to spare additional blood sampling in neonates.
Materials and Methods
This retrospective observational study was conducted at a tertiary care center in Gujarat, India. The study compares sodium and potassium concentrations between ABG and Serum electrolytes and establishes a relationship between both to spare additional blood sampling in neonates to decrease the frequency of phlebotomies. The mean ± SD (standard deviation) for K+ and Na+ in arterial blood are 3.6 ± 0.9 and 134 ± 12.25 mmol/L, respectively, according to the earlier study by Nanda et al. 14 In venous blood, the mean ± SD for K+ and Na+ is 4.1 ± 0.9 and 137 ± 13.75 mmol/L, respectively. The total size for samples of 100 was adequate to achieve a power of 70.0% based on the results and a 5% α-error. Patients admitted in the NICU whose ABG analysis and venous blood sample analysis for electrolyte testing were done within 30 minutes of difference were included. Patients whose ABG & S. Electrolytes are not prescribed together and whose samples are improper or insufficient were excluded from the study. Two ml blood from arteries was collected for analysis of ABG and 2 ml blood from veins was collected for electrolyte estimation. Both samples were processed on GEM PREMIER 3000 and Roche AVL 9180 Electrolyte Analyzer by Potentiometry of ISE principle. Data was collected after taking written informed consent from the parents/relatives and the Institutional Ethical Clearence (IEC) was obtained for the study.
Statistical Analysis: All the data required for this study were collected and analyzed statistically to determine the significance of different parameters by using the commercially available statistical software MedCalc version 23.0.2 and Microsoft 365 (Office). All values were given as mean ± SD. Comparisons between the two methods were made using Student’s t-test (paired) and associations were found using Pearson’s correlation coefficient.
Results
The present study was done on 100 NICU patients according to the criteria of inclusion and exclusion. The mean level of Na+ in ABG was 135.05 ± 6.69 mmol/L compared to 135.6 ± 6.54 mmol/L in serum samples (Table-1). There was significantly no difference when the mean plus/minus SD of sodium levels was compared between ABG and Serum samples (P = 0.325). The mean level of K+ in ABG was 3.908 ± 0.86 mmol/L compared to 4.119 ± 0.91 mmol/L in serum samples (Table -1). A significant difference was found when comparing the mean ± SD of potassium levels between ABG and Serum samples (P < 0.0001).
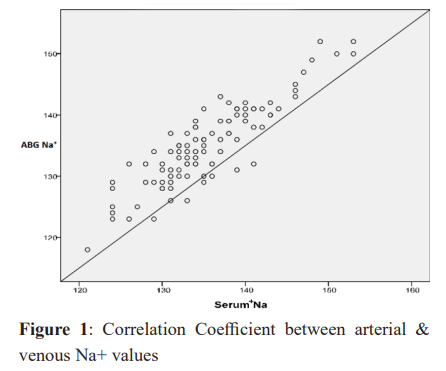
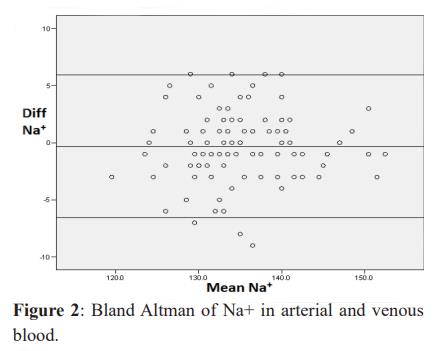
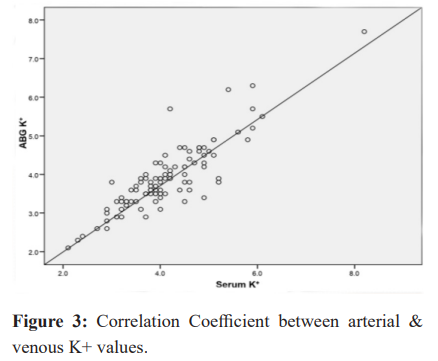
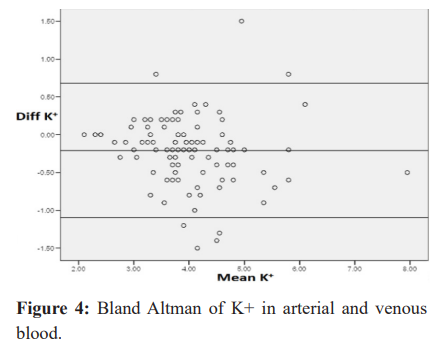
The strength of the relation between the two devices for sodium and potassium was analyzed using Pearson’s correlation coefficient. Figure 1 shows a positive correlation between the two methods (R = 0.88) for sodium level and Figure-3 shows a positive correlation between the two methods (R = 0.88) for potassium level. The Bland-Altman plots of ABG & Serum Na+ & K+ show limits of agreement of 95% in Figures 2 & 4.
Discussion
The study was carried out in the Department of Biochemistry along with NICU. In this research, we analyzed electrolytes like Na+ and K+ in the arterial and venous blood of the NICU neonates. Our study found that the mean ABG Na+ and K+ were 135.05 ± 6.69 mmol/L and 3.908 ± 0.86 mmol/L respectively. The mean serum values of Na+ and K+ were 135.6 ± 6.54 mmol/L and 4.119 ± 0.91 mmol/L respectively. The P values for Na+ and K+ from the comparison using Student’s t-test were 0.325 and less than 0.0001 between the two devices. The degree of concordance between the two tools for Na+ and K+ was evaluated through Pearson’s correlation coefficient. There was significant consensus regarding N+ and K+ from the two devices, the R values for Na+ and K+ were 0.88 and 0.88 correspondingly.
Our data align with previous studies comparing electrolyte levels in the estimations of blood from arteries and veins. Jat et al,. conducted a prospective observational study of around 200 paired blood samples from arteries and veins from patients in the ICU. The study result showed that there were no significant differences between Na+ and K+ measurements made using an automated chemistry analyzer and an analyzer for ABG. The clinic can trust blood gas results to make important decisions.15 Tang et al., identified inconsistencies in a comparative analysis of Na+ and K+ levels, and the findings from blood analysis from arteries and veins revealed significant variations in the average concentrations of K+ (P < 0.001) and Na+ (P = 0.001), but the size of the difference decreased inside the US-CLIA overall permitted error (TEa), thus it is plausible to evaluate venous blood electrolyte levels during the urgent evaluation using ABG electrolyte levels.16 Tyagi and colleagues discovered that it is inappropriate to recommend interchangeable use of electrolyte results due to significant differences between the two devices, AA and ABG. Conversely, one can make treating decision based on the K+ level measured by the ABG analyzer while the result from the biochemistry analyzer is in waiting time.17 According to Doddamani et al., a retrospective cross-sectional study conducted in a hospital on critically ill neonates, serum potassium levels and pre-heparinized arterial potassium levels can be interchanged. Additionally, they discovered a robust positive association between blood electrolyte levels of arteries and veins. Additionally, they discovered that the benefit of estimating electrolytes solely in arterial blood speeds up turnaround, enabling an early response and preventing a newborn from receiving repeated pricks.18
Some of the previous studies found different findings than ours. In a cross-sectional retrospective study involving 200 patients, Devaki et al., identified notable differences in the sodium mean of 135.62 in venous compared to 134.08 in arterial blood and the potassium mean of 4.20 compared to 3.80, concluding that electrolyte levels in serum obtained from venous blood samples via a standard autoanalyzer cannot be used by those from arterial blood samples analyzed through ABG analyzer.19 Zamanabadi et al., a cross-sectional study done on cardiac patients found a difference between the sodium levels measured by ABGA and the sodium level measured by the Autoanalyzer.20 Madhavi et al., noted comparable results in their research, stating that doctors need to be careful when interchangeably using electrolyte reports generated by auto analyzers and ABG analyzers.21 A retrospective study conducted by Kim et al., involving around 450 preterm infants in NICU. They found that the average Na+ level (mmol/L) measured through ABGA was lower (134.6 ± 3.5) compared to the mean level (mmol/L) determined by an autoanalyzer (138.8 ± 4.7) and concluded that for preterm infants of NICU, the levels of sodium ion determined by the autoanalyzer and the ABGA might not match.22 Gupta et al., a retrospective study done in the Biochemistry Laboratory found that the mean result was significantly different for Na+ and K+ using the electrolyte analyzer and ABG analyzer. And said that one should be careful using these results in an exchangeable manner.11 Budak et al., a retrospective study done on 1105 patients hospitalized in the ICU found that because of the differences between the Na+ and K+ test findings acquired with an ABG and an AA, the data cannot be used interchangeably in clinical practice.23 Jain et al., carried out an observation study on 200 ICU patients comparing the results of electrolytes measured from ABGA and autoanalyzer and found that the level of sodium is lower in ABGA compared to serum sodium measured by autoanalyzer while there is no major difference in the potassium level between the two devices.10
The constraints of our research include the retrospective design, a small sample size, and the absence of other variables such as neonatal demographics. Another constraint was a pre-analytical error (sampling error), such as the ABG samples being collected with standard syringes containing liquid heparin that may dilute the blood samples.
Conclusion
The study will give us guides on the correlation between ABG and serum electrolytes, therefore, probably reducing unnecessary needle punctures, blood loss of neonatal patients and prevention of hazards by multiple phlebotomies.
Conflict of Interest
None
Source of Support
Nil
Supporting File
References
- Buckley MS, Leblanc JM, Cawley MJ. Electrolyte disturbances associated with commonly prescribed medications in the intensive care unit. Crit Care Med 2010;38(6):S253-64. doi: 10.1097/ CCM.0b013e3181dda0be
- Whelan B, Bennett K, O'Riordan D, et al. Serum sodium as a risk factor for in-hospital mortality in acute unselected general medical patients. QJM 2009;102(3):175-82. doi: 10.1093/qjmed/hcn165
- Dimeski G, Morgan TJ, Presneill JJ, et al. Disagreement between ion selective electrode direct and indirect sodium measurements: estimation of the problem in a tertiary referral hospital. J Crit Care 2012;27(3):326.e9-16. doi: 10.1016/j. jcrc.2011.11.003
- Scott MG, LeGrys VA, Klutts JS. Electrolytes and blood gases. Tietz textbook of clinical chemistry and molecular diagnostics 2006. Saunders WB. Philadelphia:983-1018.
- Hoekstra M, Vogelzang M, Drost JT, et al. Implementation and evaluation of a nurse-centered computerized potassium regulation protocol in the intensive care unit--a before and after analysis. BMC Med Inform Decis Mak 2010;10:5. doi: 10.1186/1472-6947-10-5
- Vincent JL, Moore AE, Kochanek FA, et al. Textbook of Critical Care. 8th ed. Philadelphia (PA: Saunders; 2011. Saunders WB. Philadelphia:p. 1376.
- Castro D, Patil SM, Zubair M, et al. Arterial blood gas [Internet]. StatPearls - NCBI Bookshelf. 2024. Available from: https://www.ncbi.nlm.nih.gov/ books/NBK536919/.
- Yi HC, Shi WS, Zhang YH, et al. Comparison of electrolyte and glucose levels measured by a blood gas analyzer and an automated biochemistry analyzer among hospitalized patients. J Clin Lab Anal 2020;34(7): e23291. doi: 10.1002/jcla.23291
- Yilmaz S, Uysal HB, Avcil M, et al. Comparison of different methods for measurement of electrolytes in patients admitted to the intensive care unit. Saudi Med J 2016;37(3):262-7. doi: 10.15537/ smj.2016.3.13539
- Jain A, Subhan I, Joshi M. Comparison of the point-of-care blood gas analyzer versus the laboratory auto-analyzer for the measurement of electrolytes. Int J Emerg Med 2009;2(2):117-20. doi: 10.1007/ s12245-009-0091-1
- Gupta S, Gupta AK, Singh K, et al. Are sodium and potassium results on arterial blood gas analyzer equivalent to those on electrolyte analyzer? Indian J Crit Care Med 2016;20(4):233-7. doi: 10.4103/0972-5229.180044
- Allardet-Servent J, Lebsir M, Dubroca C, et al. Point-of-Care Versus Central Laboratory Measurements of Hemoglobin, Hematocrit, Glucose, Bicarbonate and Electrolytes: A Prospective Observational Study in Critically Ill Patients. PLoS One 2017;12(1):e0169593. doi: 10.1371/journal. pone.0169593
- Bielitzki LD. CLIA (Clinical Laboratory Improvement Amendments) '88: alternatives proposed by CLMA (Clinical Laboratory Management Association). Clin Lab Manage Rev 1990;4(5):359-66, 369-71.
- Nanda SK, Ray L, Dinakaran A. Agreement of arterial sodium and arterial potassium levels with venous sodium and venous potassium in patients admitted to intensive care unit. J Clin Diagn Res 2015;9(2):BC28-30. doi: 10.7860/ JCDR/2015/12418.5602. Erratum in: J Clin Diagn Res 2015;9(11):ZZ01. doi: 10.7860/ JCDR/2015/12418.6817
- Jat NK, Sushma BJ, Roy M, et al. Study on comparison of electrolytes in hospitalized patients of critical care medicine by automated biochemistry analyzer and arterial blood gas analyzer. Int J Clin Biochem Res 2024;11(1):52-8. Available from: https://www.ijcbr.in/html-article/22073
- Tang S, Mei Z, Huang D, et al. Comparative analysis of hemoglobin, potassium, sodium, and glucose in arterial blood gas and venous blood of patients with COPD. Sci Rep 2024;14(1):5194. doi: 10.1038/ s41598-024-55992-9
- Tyagi N. ABG Analyzer for Electrolyte Measurement in ICU Patients: To Do or Not to Do. Indian J Crit Care Med 2024;28(5):416-418. doi: 10.5005/jp-journals-10071-24722
- Doddamani P, Shivashankar KK, Ramachandra SC, Aman I, Maduvanahalli Nataraj S. Agreement of measurement between arterial and venous electrolyte levels in neonates in a Tertiary Care Hospital. J Lab Physicians 2020;12(1):20-26. doi: 10.1055/s-0040-1713061
- Devaki RN, Kasargod P, Urs AR, et al. A Retrospective Database Analysis to Investigate if Electrolytes in Venous Blood are Equivalent to the Levels in Arterial Blood. Indian J Crit Care Med 2024;28(5):442-446. doi: 10.5005/jp-journals-10071-24702
- Zamanabadi MN, Zamanabadi TN, Alizadeh R. Measuring serum sodium levels using blood gas analyzer and auto analyzer in heart and lung disease patients: A cross-sectional study. Ann Med Surg (Lond) 2022;78:103713. doi: 10.1016/j. amsu.2022.103713.
- Trivedi M, Mohammad J, Mohd S. A comparative study on ABG analyzer versus laboratory analyzer to estimate Electrolytes. Int J Health & Clin Res 2021;4(21):46-49.
- Kim H, Kim JK, Cho SC. Comparison of sodium ion levels between an arterial blood gas analyzer and an autoanalyzer in preterm infants admitted to the neonatal intensive care unit: a retrospective study. BMC Pediatr 2016;16:101. doi: 10.1186/ s12887-016-0636-4.
- Budak YU, Huysal K, Polat M. Use of a blood gas analyzer and a laboratory autoanalyzer in routine practice to measure electrolytes in intensive care unit patients. BMC Anesthesiol 2012;12:17. doi: 10.1186/1471-2253-12-17.


